
I posted a few months ago about a new R package I wrote with Filipe Matias-- it's available for download on GitHub. Last week we extended the GitHub tutorial to include interpolation methods and raster visualization/mapping example code. Spatially Challenged readers have asked me to write tutorials on these techniques before, but I had been… Continue reading Inverse Distance Weighting and Kriging in R
Tag: statistics
Averaging Plot Data in R– Updated Blog Post
Note: the below was originally written and published in January 2019. I edited the post for clarity and added a few notes on using the Tidyverse suite of packages to do summarize data in R, but you can still find the original here. Not an R user but need an efficient way to average plot… Continue reading Averaging Plot Data in R– Updated Blog Post
Making Violin Plots
Last week I posted some tips for reading violin plots, and this week I decided to play around with making some of my own! I use box plots pretty regularly, so I first tried remaking one of my own box plots as a violin plot instead. Today I'm only going to share information about making… Continue reading Making Violin Plots
Reading Violin Plots
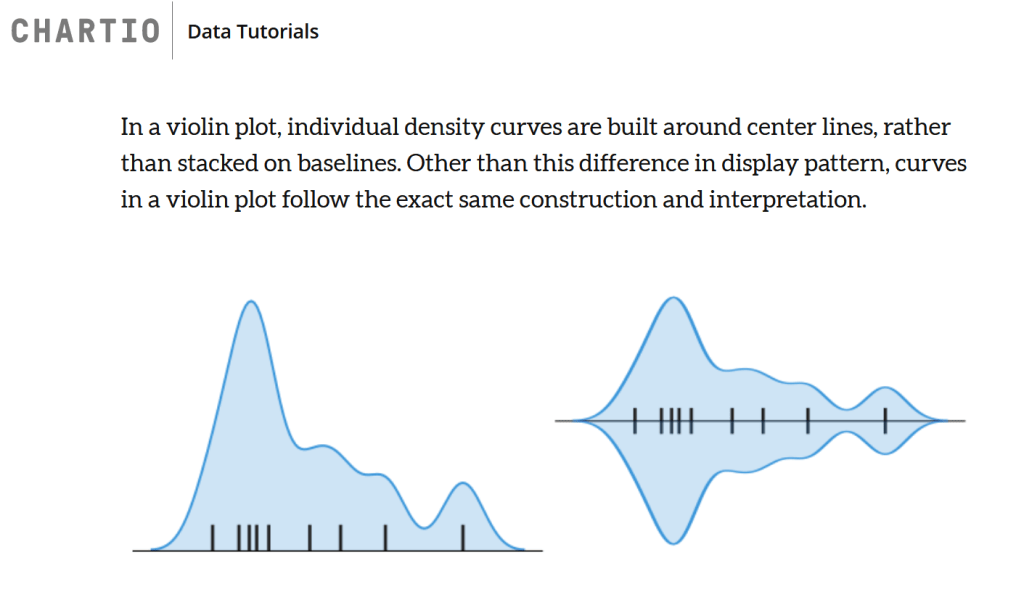
I have been seeing more violin plots recently and wanted to share some tips for reading all the information violin plots can show. At first glance they can be confusing and hard to read, but really, all the parts of a violin plot are probably something you've seen in another graph type before. First, what… Continue reading Reading Violin Plots
Two ANOVA Tutorials
Today I am going to continue highlighting resources I found helpful when studying for my prelims (which I successfully passed!). The last post on this topic was about blocking trials, and I'm glad I reviewed blocking and randomization for my exam since it was helpful in answering two of the questions on my exam. The… Continue reading Two ANOVA Tutorials
Blocking Field Trials and the First Law of Geography
I'm studying for my prelims this semester, which involves going back over the classes I've taken over the last 4 years, reviewing my research proposal, and just generally refreshing my memory about the topics a person with a PhD in agronomy should know. I'm focusing on traditional statistics and experimental designs this week, which reminded… Continue reading Blocking Field Trials and the First Law of Geography
Making Box Plots
Last month I posted about how to read box plots, and today I'm sharing how you can make your own. I picked two online tools that don't require you to calculate the mean and quartiles yourself and shared a quick couple lines of code for the R users out there. Let's start with Desmos! Desmos… Continue reading Making Box Plots
Box and Whisker Plots
Box and whisker plots are one of my favorite ways to visualize data, but they can be challenging to read if you haven't seen them before. Today I'm going to show a couple examples, and in the future I'll show you how to make your own! Firstly, box and whisker plots are also called boxplots.… Continue reading Box and Whisker Plots
Vocab Word: Multicollinearity
I'm going to continue highlighting words I get asked about regularly. Today's feature: multicollinearity! This is a word you've probably heard about in stats class, but might not know specifically what it is or why it matters. We worry about multicollinearity when we are using multiple independent variables to model one output. One of your… Continue reading Vocab Word: Multicollinearity
Data Downloads: 2017 Ag Census
The 2017 Census of Agriculture results will be released on Thursday, April 11th. If you're looking for updated production information, this is a great resource. Here are some quick facts about the census and some ways to see the results! What is the Census of Agriculture? It's a record of all the humans, animals, and… Continue reading Data Downloads: 2017 Ag Census
