
Note: the below was originally written and published in November 2018. I edited the post for clarity and added a few notes on accessing some learning resources in R Studio itself, but you can still find the original here. This month I'm making lots of graphs in R and wanted to share some of the… Continue reading R Cheat Sheets: ggplot2- Updated Blog Post
Tag: graphs
Making Violin Plots
Last week I posted some tips for reading violin plots, and this week I decided to play around with making some of my own! I use box plots pretty regularly, so I first tried remaking one of my own box plots as a violin plot instead. Today I'm only going to share information about making… Continue reading Making Violin Plots
Reading Violin Plots
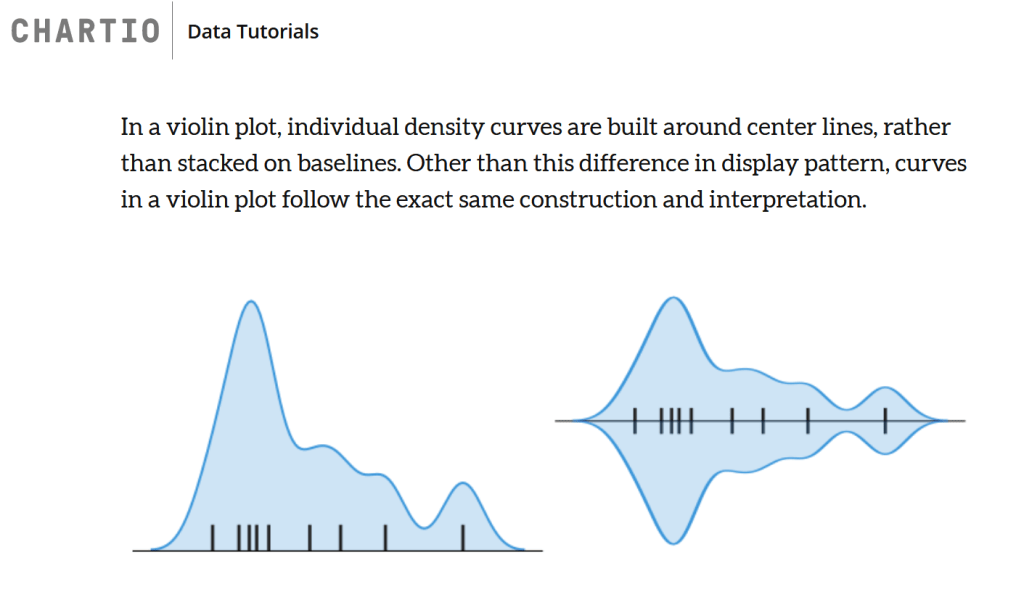
I have been seeing more violin plots recently and wanted to share some tips for reading all the information violin plots can show. At first glance they can be confusing and hard to read, but really, all the parts of a violin plot are probably something you've seen in another graph type before. First, what… Continue reading Reading Violin Plots
Making Box Plots
Last month I posted about how to read box plots, and today I'm sharing how you can make your own. I picked two online tools that don't require you to calculate the mean and quartiles yourself and shared a quick couple lines of code for the R users out there. Let's start with Desmos! Desmos… Continue reading Making Box Plots
Draw.io
Last week I posted about my usual QGIS to R workflow, and shared a little flowchart: This week I wanted to highlight the software I used to make it-- Draw.io, which is an open source version of Microsoft Visio. Visio is great, but it's expensive, so Draw.io usually makes more sense for me. Draw.io lets… Continue reading Draw.io
R Cheat Sheets: ggplot2
This month I'm making lots of graphs in R and wanted to share some of the resources I use to both inspire the types of graphs I use and then actually make them. R is an incredibly powerful, free statistics software. It can be used to process large data sets, run all sorts of statistics,… Continue reading R Cheat Sheets: ggplot2
Maintain your Aspect Ratio!
I spent most of this week at a conference (American Society of Agronomy and Crop Science Society of American joint conference in Baltimore). I learned all sorts of interesting things that are mostly not relevant to this blog, so maybe don't expect a whole lot more conference related content. Overall, the week was a great… Continue reading Maintain your Aspect Ratio!
