
Last week I posted about my usual QGIS to R workflow, and shared a little flowchart: 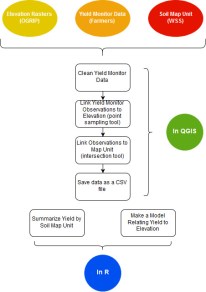
This week I wanted to highlight the software I used to make it– Draw.io, which is an open source version of Microsoft Visio. Visio is great, but it’s expensive, so Draw.io usually makes more sense for me.
Draw.io lets you build diagrams and flowcharts super easily, using a drop and drag menu of shapes and a wide range of colors and text options (see below). Basically any shape you want is easily available. 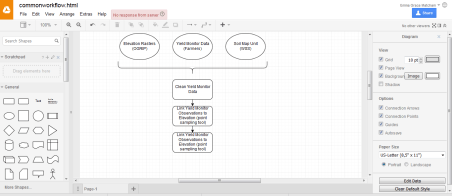
 When you’re done building your shapes, you can save an editable version to your Google Drive account and export a JPEG or SVG image file.
The platform is really user friendly, so I’m not going to get into many how-tos, but I thought it was worth a post because it’s a good tool that not many people know about. The results are more professional looking than fussing with shapes in PowerPoint, and it’s free and efficient. Maybe Draw.io has features that would work for you!

[…] highlighted Draw.io, a free flow charting tool comparable to Microsoft Visio (see that intro here). I use Draw.io pretty frequently, but I still haven’t written more detailed how-tos for […]
LikeLike