
I came across this truly delightful introduction to R and summary statistics tutorial while reminding myself how to write functions in R. I was impressed by how Teacups, Giraffes, & Statistics covers R basics with clarity and specificity while being incredibly endearing.
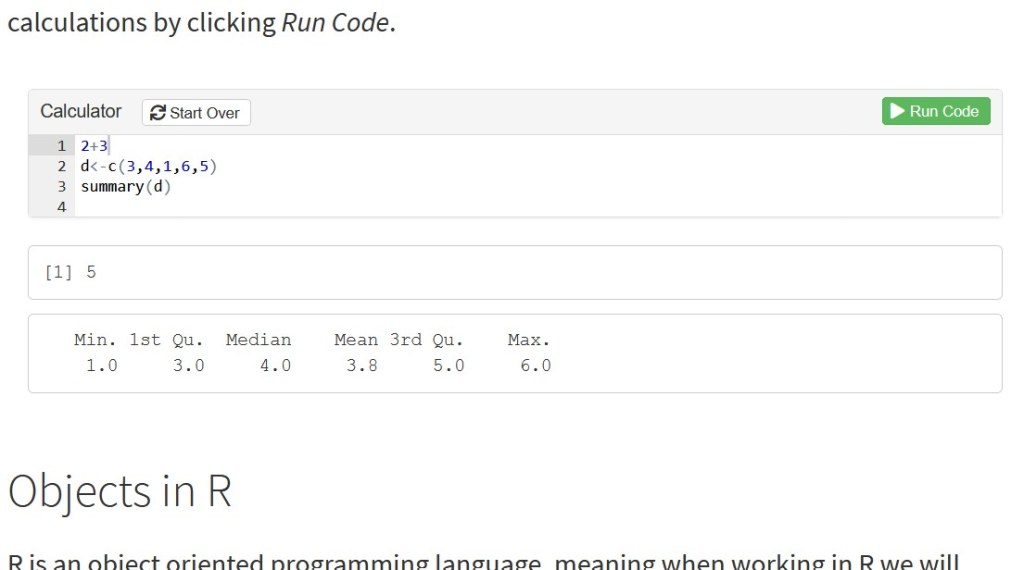
This was the first place I’ve seen interactive R windows on websites, and it’s great. Instead of having to open Rstudio on my own computer to use the example code, I ran code chunks on the website itself. In the example to the left, the authors provided 2+3 in the calculator window. I added the next two lines of code and clicked the green “Run Code” button, and my R output was displayed! I also really liked their variance and standard deviation comparisons in the “The Spread of the Data” module.
Whether you’re looking for a charming resource for new R users or just want to see an excellent tutorial example, I highly recommend Teacups, Giraffes, & Statistics by Hasse Walum and Desirée de Leon.
PS: I’m always looking for great beginner-friendly R and QGIS guides– drop links to your favorites in the comments section!
