
I’m gonna jump back into an older Spatially Challenged series– data sources. The National Oceanic and Atmospheric Administration manages all sorts of great resources, and they like short and memorable urls (weather.gov, for instance). Today I’m talking about climate.gov, which is a great source for maps and zip code level weather data.
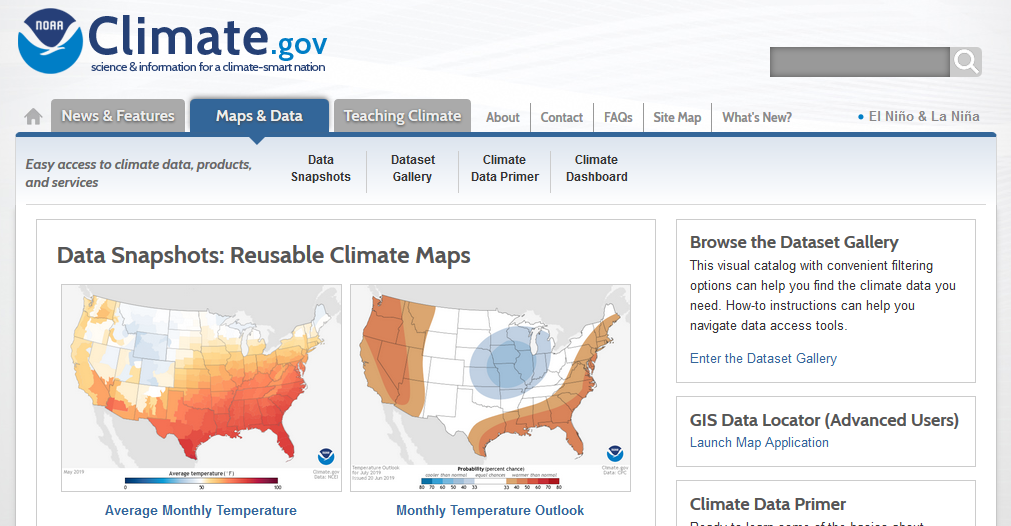
Let’s start with maps! When you go to climate.gov, navigate to the second tab on the main menu– Maps & Data. From this page, there are three features I’d like to point out: Data Snapshots (big center panel), GIS data locator (far right), and Past Data By Zip Code (bottom).
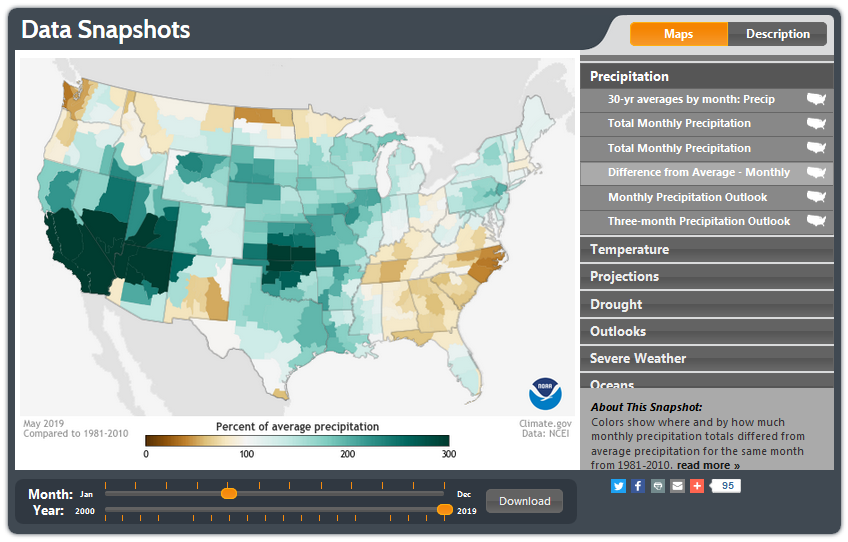
If you click the “Data Snapshots” on the secondary menu across the top, it takes you to a portal where you can see and compare lots of different data on a US map. The data types are across the right-hand menu, and the time period is along the bottom. There’s even options to post your map on social media or share with friends!
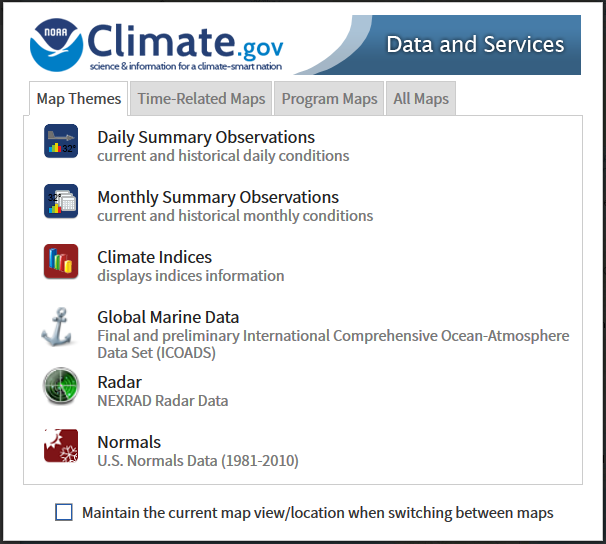
If you aren’t seeing the information you want on a Data Snapshot map, check out the GIS Data Locator feature. I like these maps because you can zoom in and out really easily, and there are lots of detailed data options.
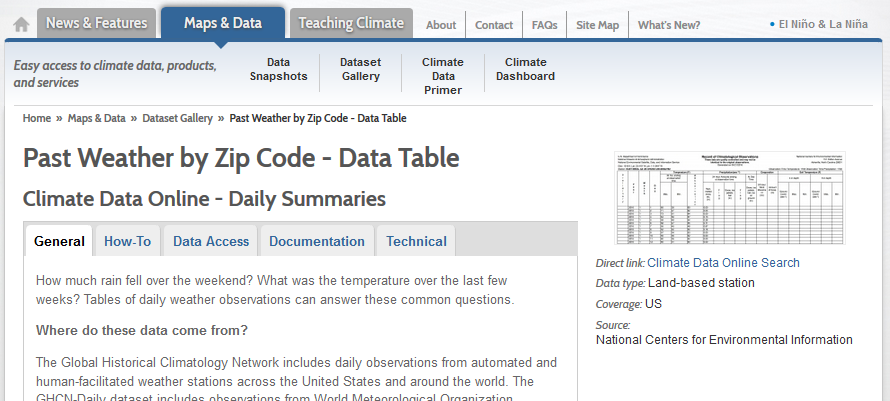
If there’s a specific location you need data for, I recommend using the Past Weather by Zip Code, which is available by navigating through the climate.gov homepage or by going here. Since NOAA provides such a great how-to, I’m not going to go through the step-by-step.
Overall, my favorite part of the NOAA climate.gov portal is the accessibility of both past weather and long term climate trends. The maps are easy to read, and even their meta-data is readily available. Enjoy!
