
Are you as obsessed with ColorBrewer as I am? I am making a map where I color Ohio counties based on region, and used ColorBrewer to pick colors.
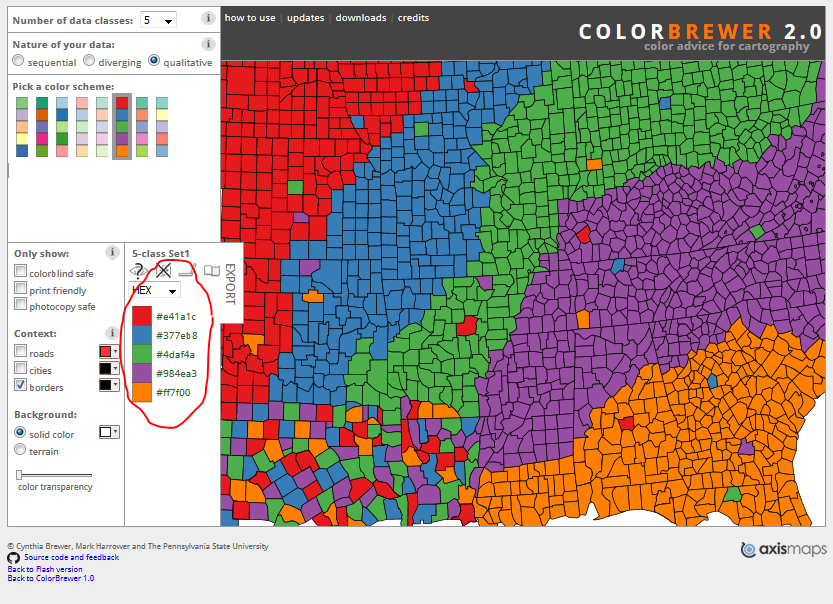
The first thing I did was go to ColorBrewer and find a qualitative color set for 5 categories of data.
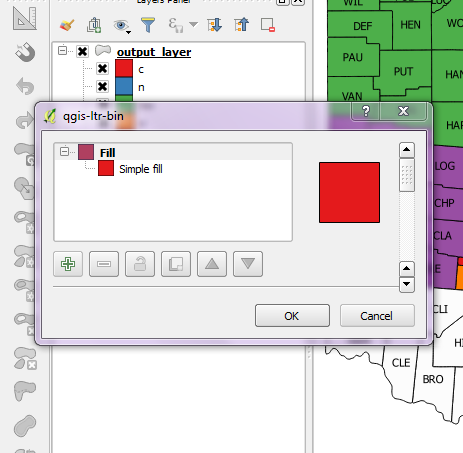
Next I used the HEX codes provided to set my colors in QGIS. I just double clicked the color square and then went to “Simple fill” and scrolled down til it gave me an option to change the color.
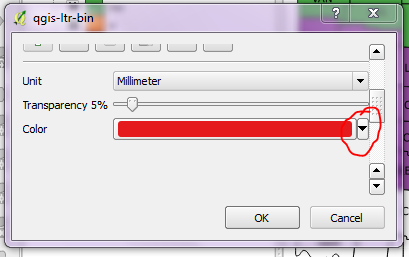
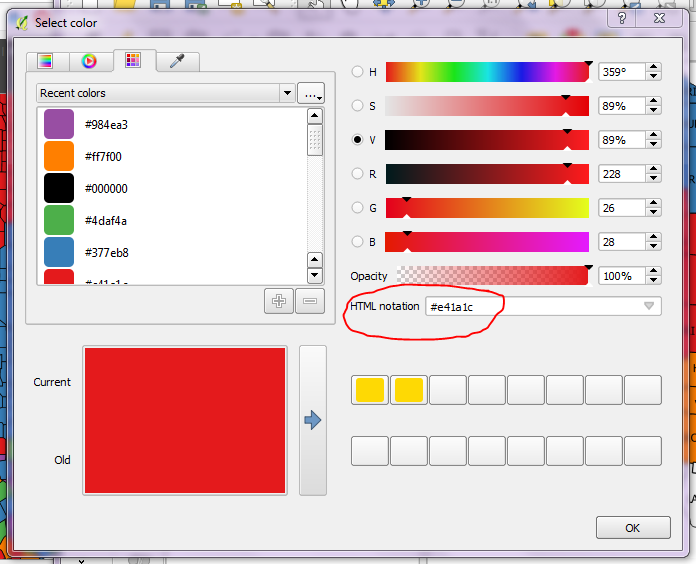
Then you just put the Hex code in where it asks for colors in HTML notation.
Repeat for all your colors and you’re good to go!
ColorBrewer is a great tool for getting easy to read, professional looking color gradients or categorical sets for maps and graphs. If you want to learn more, there are more details here.

[…] layer style files it’s for continuous data or rule-based formatting. This example is from the ColorBrewer example I showed last month, and is a very simple style. But, saving the layer style is the same […]
LikeLike