
Last week I mentioned terrain derivatives and promised some how-to posts. I’m going to start with an brief intro to SAGA GIS, which is my preferred software for generating terrain derivatives. SAGA was written in the early 2000s and has been regularly updated– you can learn more from its makers here. You can download SAGA from SourceForge here.

Originally SAGA was a command line software like R, but now there’s a GUI available that makes it a little more user friendly. Other ways to use SAGA include their R package and QGIS plug-in.
SAGA has many of the same functions as more common GIS software like ArcGIS or QGIS. You can use it to make maps, interpolate point data, compose images to print, and run different geostatistics. For this post I downloaded the DEM for part of Mt. Gilead State Park in Morrow County, Ohio (learn what a DEM is here). I’ll show you how to open the file and learn a little about the study area today, and in the future I’ll use the same area to show you some terrain derivatives and geostatistics.
After you’ve downloaded SAGA and decided what files you want to explore with, you’ll want to open your files in SAGA. Go the the Geoprocessing tab on the main menu, and navigate to File->Grid->Import. I used the “Import Raster” option from here because my data is stored as a GeoTIFF.

From there, a window will pop up to walk you through selecting your file. Click on the button with ellipse (in line with the “Files” label) to open the file browser. After navigating to the file, click “Okay” and your file will open!

Now that we have something open on the screen, let’s go on a little tour of SAGA. The bottom of your screen has general messages that record which tools you used and whether they were successfully executed or not. If a tool fails, you can get more details by clicking to the “Errors” tab also in that bottom window. The upper left panel is similar to your layers panel in QGIS– it displays the files you’ve imported or any additional layers you’ve created in SAGA.

Now that we have something open on the screen, let’s go on a little tour of SAGA. The bottom of your screen has general messages that record which tools you used and whether they were successfully executed or not. If a tool fails, you can get more details by clicking to the “Errors” tab also in that bottom window. The upper left panel is similar to your layers panel in QGIS– it displays the files you’ve imported or any additional layers you’ve created in SAGA.
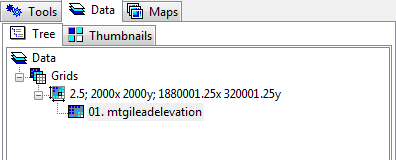
This is where SAGA starts to feel really different from other GIS. It organizes your raster data into “Grids” and everything makes more sense once you realize how the grids are named. The first number is the resolution in whatever units your data is projected in (mine is 2.5 feet). The next numbers are how many cells wide and tall your grid is (mine is a square, so the 2000x 2000y makes sense). The next numbers are the starting point of your data. My data is in a foot-based projection of NAD83 for Northern Ohio, so the 7 and 6 digit numbers seem right.
The last thing we’re going to do today is visualize the data we already imported. You can double click on the file name (mtgileadelevation) to get the map to open. SAGA defaults to a rainbow gradient, which I kinda like. You can also right click on the file name and open a histogram of your data. The map and histogram will both open in the large grey area of your main screen.

Opening and viewing data is a good first step with any new software, so I’m going to stop here for the day. From here you can explore more in the Geoprocessing menu or by right clicking on your file, or you can go ahead and close out of SAGA. Later in the month I’ll get into calculating some terrain derivatives with this elevation map, so keep an eye out for more posts!

[…] you missed my posts on terrain derivatives or SAGA, you may want to jump back and read those first. Today I’m going to talk about two very […]
LikeLike
[…] Like I mentioned previously, plan and profile curvature are part of the basic terrain analysis procedure in SAGA. The Slope, Aspect, and Curvature procedure can calculate plan, profile, general, tangential, and other types of curvature. To get started, open your elevation file. If you need a reminder for how to import a DEM in SAGA, check out the intro to SAGA post here. […]
LikeLike
[…] from GeoTiffs or other raster formats. I have an overview of the data format in a post blog post (Intro to SAGA GIS), but it’s worth reiterating here too. In the photo to the left of a data layer in SAGA, […]
LikeLike